
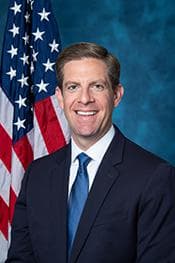
U.S. Representative
Mike Levin
California District 49
DemocratProgressive
Votes on Record
495
across 19 categories
Contact
U.S. Representative
California District 49
Votes on Record
495
across 19 categories
Contact
Voting Profile
Most Active Policy Areas
495
Votes Analyzed
Data sources: voteview, congress.gov
Political Position
The average House Democrat scores about -0.380, so Levin votes somewhat closer to the center than the typical member of his party, while still clearly within its mainstream.
Near the average for Democrats (-0.38)
Data source: VoteView NOMINATE scores (UCLA/UC San Diego)
Policy Positions
495
total votes analyzed
At a Glance
Mike Levin represents California in the U.S. House of Representatives. This profile covers 495 recorded votes, most of them cast in 2025 and 2026. His ideology score puts him slightly more moderate than the average Democrat. Many of his votes are shaped by procedural moves and by bills that reach the floor from the House majority. The largest share of his votes (275) falls into a general 'other' category, and he voted Yea on about two-thirds of those. Recent examples include support for the National Fraud Enforcement Division Act and the Retire through Ownership Act, and opposition to the PROOF Act.
On fiscal and defense matters, Levin voted against most budget-related measures in this record (7 Yea, 22 Nay). That includes a vote against the fiscal year 2027 congressional budget resolution and a vote against a continuing appropriations bill, which is a temporary measure to keep the government funded. On defense he voted Yea about 63% of the time. He opposed the National Defense Authorization Act for Fiscal Year 2027, the yearly bill that sets military policy and spending levels. He supported the Take Care of America's Veterans Act and a War Powers Resolution measure directing the President to remove U.S. forces from hostilities in Lebanon.
On environment and energy, he voted Yea on about 35% of 34 votes. His recent votes include opposing a resolution that would have overturned an EPA decision on California's engine pollution standards for harbor vessels, and supporting the Water Resources Development Act and the Ratepayer Protection Act. On healthcare he voted Yea about 79% of the time. Several of his recent healthcare votes were procedural, such as motions to recommit and votes on the 'previous question.' These procedural votes often reflect broader disagreements over how bills are brought up or written, rather than simple support for or opposition to a policy.
He voted Yea on all recorded votes in foreign policy (11 of 11) and labor (5 of 5), and on most taxation votes (8 of 11). He voted Nay on most immigration votes (6 of 8) and housing votes (5 of 8). Some categories, such as reproductive rights and civil rights, have only one recorded vote each. That is not enough to draw conclusions about his positions in those areas.
Voted against the fiscal year 2027 congressional budget resolution and against a fiscal year 2027 continuing appropriations bill, part of a broader pattern of 22 Nay votes out of 29 budget-related votes.
Voted against the National Defense Authorization Act for Fiscal Year 2027, while supporting the Take Care of America's Veterans Act.
Supported a War Powers Resolution measure directing the President to remove U.S. Armed Forces from hostilities in Lebanon, which reflects a position on Congress's role in approving military action.
Voted against a resolution that would have overturned an EPA decision approving California's pollution standards for commercial harbor vessels, keeping the state's rules in place.
Supported the Water Resources Development Act and the Ratepayer Protection Act, showing support for some energy and infrastructure legislation even though he voted Nay on most environment and energy measures overall.
In December 2025 he voted Yea on motions to recommit related to the Lower Health Care Premiums for All Americans Act and the Do No Harm in Medicaid Act. A motion to recommit is a procedural vote, usually offered by the minority party, that seeks to send a bill back for changes.
Voted Yea on all 11 recorded foreign policy votes and all 5 recorded labor votes.
Voted Nay on 6 of 8 immigration-related votes in this record.
Yes/no split for each topic is on the Congressional Votes cards below.
Analysis updated: October 6, 2026
Campaign Finance
Includes all authorized campaign committees (principal committee, joint fundraising, and other authorized committees). Outside spending by Super PACs and independent groups is shown separately below.
Verify on FEC.gov →Career: $24.0M
Fundraising Over Time
Contribution Sources
87%
13%
0%
Individual Breakdown
Itemized (>$200)
$2.3M
Small Dollar (≤$200)
$217K
Donation Sizes
Share of individual contribution dollars by donation size, current election cycle.
Where the Money Comes From
Itemized individual contributions only (donations over $200 report the donor's state). Small-dollar donations are not included because the FEC does not itemize them.
Top Contributors
Top Contributing Industries
Top Donor Employers
Employer as self-reported by itemized donors. “Not Employed” and “Self-Employed” typically rank highest for small-dollar campaigns and include retirees.
Where the Money Goes
Spending by Purpose
Purpose categories are self-reported on FEC filings; large “Other” totals are common.
Top Payees
RCBS PAYROLL SERVICES
FIRST INDUSTRIAL REALTY TRUST
WESTWEST DIGITAL, LLC
CARD SERVICE CENTER
DCCC
CAPITOL COMPLIANCE ASSOCIATES
THE FROST GROUP LLC
ACTBLUE TECHNICAL SERVICES
Detailed Breakdown
Expenditures
Operating Costs
$1.9M
Operating Offsets
$16K
Net Operating
$1.9M
Refunds
Individual Refunds
$25K
Committee Refunds
$1K
Outside Spending (Super PACs)
Supporting
$3.2M
Opposing
$6.3M
Total Outside Spending
$9.5M
Top Outside Spenders
CONGRESSIONAL LEADERSHIP FUND
INDEPENDENCE USA PAC
DCCC
BLOOMFIELD, BILL
FLIP THE 49TH! NEIGHBORS IN ACTION
PLANNED PARENTHOOD ACTION FUND OF THE PACIFIC SOUTHWEST PAC
AMERICAN FEDERATION OF STATE COUNTY & MUNICIPAL EMPLOYEES P E O P L E
LCV VICTORY FUND
Independent expenditures are made without coordination with the candidate. Source: FEC Schedule E filings.
Voting Record
495 votes across 19 categories
Bars show how they voted on the key bills we analyzed in each topic. Tap a card to see every vote.