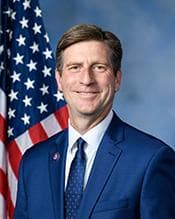
U.S. Representative
Greg Stanton
Arizona District 4
DemocratModerate Liberal
Votes on Record
495
across 19 categories
Contact
U.S. Representative
Arizona District 4
Votes on Record
495
across 19 categories
Contact
Voting Profile
Most Active Policy Areas
495
Votes Analyzed
Data sources: voteview, congress.gov
Political Position
Greg Stanton's NOMINATE score of -0.278 places him as a moderate liberal within the Democratic Party. The average House Democrat scores around -0.380, meaning Stanton votes more conservatively than most members of his party. In practical terms, he generally supports Democratic priorities but is more willing than many of his colleagues to break from the party position on certain issues.
More conservative than the average Democrat (-0.38)
Data source: VoteView NOMINATE scores (UCLA/UC San Diego)
Policy Positions
495
total votes analyzed
Overview
Greg Stanton is a Democratic U.S. Representative from Arizona whose voting record reflects a moderate-liberal position within his party. Across 495 recorded votes, he consistently supports legislation related to healthcare, labor protections, infrastructure investment, and foreign policy. He has voted in favor of every foreign policy and labor measure that came before him during this period. On fiscal issues, Stanton has frequently voted against budget resolutions and continuing appropriations measures, which is consistent with Democratic opposition to Republican-led spending frameworks. He opposed the fiscal year 2027 budget resolution and related continuing resolutions. In healthcare, he supported motions related to Medicaid protections and efforts to lower health care premiums, voting in favor of these measures roughly 79% of the time. Stanton's record on environment and energy is more nuanced than a simple party-line pattern would suggest. He voted against a congressional disapproval resolution targeting California's harbor craft emissions standards, siding with maintaining environmental regulations, but his overall yea rate in this category is just 32%, reflecting opposition to several energy-related measures. On immigration and housing, he voted against the majority of measures that came to the floor, with yea rates of 25% and 37.5% respectively. His defense voting pattern shows support for veterans' services alongside engagement with war powers questions. He voted for the Take Care of America's Veterans Act and supported a War Powers Resolution measure directing the removal of U.S. forces from hostilities in Lebanon, while opposing a similar but differently scoped Lebanon withdrawal measure — suggesting attention to the specific terms of each proposal rather than a blanket position.
Key Positions
By Policy Area
Analysis updated: September 18, 2026
Campaign Finance
Includes all authorized campaign committees (principal committee, joint fundraising, and other authorized committees). Outside spending by Super PACs and independent groups is shown separately below.
Verify on FEC.gov →Career: $13.8M
Fundraising Over Time
Contribution Sources
70%
30%
0%
Individual Breakdown
Itemized (>$200)
$1.4M
Small Dollar (<$200)
$91K
Donation Sizes
Share of individual contribution dollars by donation size, current election cycle.
Where the Money Comes From
Itemized individual contributions only (donations over $200 report the donor's state). Small-dollar donations are not included because the FEC does not itemize them.
Top Contributors
Top Contributing Industries
Top Donor Employers
Employer as self-reported by itemized donors. “Not Employed” and “Self-Employed” typically rank highest for small-dollar campaigns and include retirees.
Where the Money Goes
Spending by Purpose
Purpose categories are self-reported on FEC filings; large “Other” totals are common.
Top Payees
DEMOCRATIC CONGRESSIONAL CAMPAIGN COMMITTEE - CONTRIBUTIONS
ADAMS, CAMERON
FROST GROUP
RISING TIDE INTERACTIVE
ADP
TOMAS, JEAN RACHEL
AMERICAN EXPRESS
NGP VAN, INC.
Detailed Breakdown
Expenditures
Operating Costs
$854K
Operating Offsets
$458.01
Net Operating
$853K
Refunds
Individual Refunds
$8K
Outside Spending (Super PACs)
Supporting
$614K
Opposing
$222K
Total Outside Spending
$836K
Top Outside Spenders
HOUSE MAJORITY PAC
UNITED WE CAN
STOP STANTON PAC
CONGRESSIONAL LEADERSHIP FUND
SEIU COPE (SERVICE EMPLOYEES INTERNATIONAL UNION COMMITTEE ON POLITICAL EDUCATION)
WORKING AMERICA
NEXTGEN CLIMATE ACTION COMMITTEE
FEMINIST MAJORITY
Independent expenditures are made without coordination with the candidate. Source: FEC Schedule E filings.
Voting Record
495 votes across 19 categories