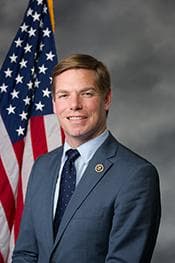
U.S. Representative
Eric Swalwell
California District 14
DemocratProgressive
Votes on Record
409
across 19 categories
Contact
Contact information not yet available
U.S. Representative
California District 14
Votes on Record
409
across 19 categories
Contact
Contact information not yet available
Voting Profile
Most Active Policy Areas
409
Votes Analyzed
Data sources: voteview, congress.gov
Political Position
Eric Swalwell's voting record places him as a progressive Democrat, though he sits slightly closer to the political center than the average member of his party. His NOMINATE ideology score of -0.355 (on a scale from -1, most liberal, to +1, most conservative) is just to the right of the Democratic average of -0.380, meaning he generally votes in line with his party but occasionally breaks toward more moderate positions.
Near the average for Democrats (-0.38)
Data source: VoteView NOMINATE scores (UCLA/UC San Diego)
Policy Positions
409
total votes analyzed
Overview
Eric Swalwell is a Democratic member of the U.S. House of Representatives from California with 409 recorded votes in the dataset. His voting record reflects a consistently progressive approach across most policy areas, with particularly strong alignment on technology, foreign policy, and defense-related legislation. On healthcare, Swalwell has supported roughly half the bills that came to a vote, while opposing a significant share as well — a pattern that often reflects support for Democratic healthcare proposals and opposition to Republican-led changes to programs like Medicaid. His budget and environment/energy votes show high opposition rates, which in a Republican-controlled House typically indicates disagreement with the majority party's spending priorities and energy policies rather than opposition to those topics broadly. Swalwell shows notable engagement on defense and veterans' issues, voting in favor of the majority of defense-related bills, including veterans' services legislation. He has also supported most technology-related bills that reached the floor. His record on banking and finance bills shows consistent opposition during this period, voting against all four bills in that category. It is worth noting that a substantial number of Swalwell's recorded entries across categories are marked as 'not voting,' which may reflect absences, strategic decisions, or procedural circumstances. Voters should consider both his active votes and his participation rate when evaluating his record.
Key Positions
By Policy Area
Analysis updated: September 18, 2026
Campaign Finance
Includes all authorized campaign committees (principal committee, joint fundraising, and other authorized committees). Outside spending by Super PACs and independent groups is shown separately below.
Verify on FEC.gov →Career: $20.7M
Fundraising Over Time
Contribution Sources
89%
11%
0%
Individual Breakdown
Itemized (>$200)
$1.2M
Small Dollar (<$200)
$283K
Donation Sizes
Share of individual contribution dollars by donation size, current election cycle.
Where the Money Comes From
Itemized individual contributions only (donations over $200 report the donor's state). Small-dollar donations are not included because the FEC does not itemize them.
Top Contributors
Top Contributing Industries
Top Donor Employers
Employer as self-reported by itemized donors. “Not Employed” and “Self-Employed” typically rank highest for small-dollar campaigns and include retirees.
Where the Money Goes
Spending by Purpose
Purpose categories are self-reported on FEC filings; large “Other” totals are common.
Top Payees
BERGER HIRSCHBERG STRATEGIES
MEYER, DARLY
THE TUCKER GROUP
UNITED AIRLINES
RIVER CITY BUSINESS SERVICES
BCOM SOLUTIONS, LLC
SWALWELL, ERIC
ZAMANI, JASMINE
Detailed Breakdown
Expenditures
Operating Costs
$1.8M
Operating Offsets
$54K
Net Operating
$1.7M
Refunds
Individual Refunds
$188K
Committee Refunds
$4K
Outside Spending (Super PACs)
Supporting
$126K
Opposing
$26K
Total Outside Spending
$151K
Top Outside Spenders
ALPHA VALLEY BUSINESS AND TECHNOLOGY CONSORTIUM
WE VOTE - NOSOTROS VOTAMOS - PPAMM COMMITTEE
OHLONE AREA UNITED DEMOCRATIC CAMPAIGN
COURAGE CALIFORNIA SUPER PAC
TOGETHER WE THRIVE
PLANNED PARENTHOOD VOTES
NEA ADVOCACY FUND
SIERRA CLUB POLITICAL COMMITTEE
Independent expenditures are made without coordination with the candidate. Source: FEC Schedule E filings.
Voting Record
409 votes across 19 categories