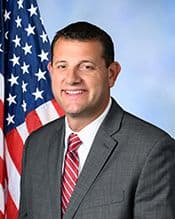
U.S. Representative
David G. Valadao
California District 22
RepublicanModerate Conservative
Votes on Record
533
across 19 categories
Contact
U.S. Representative
California District 22
Votes on Record
533
across 19 categories
Contact
Voting Profile
Most Active Policy Areas
533
Votes Analyzed
Data sources: voteview, congress.gov
Political Position
David Valadao's ideology score of 0.257 on the NOMINATE scale places him in the moderate conservative range. The average House Republican scores around 0.520, making Valadao notably more centrist than most members of his party. This positioning reflects a voting record that sometimes aligns with Democrats on certain issues while still leaning conservative overall.
More liberal than the average Republican (0.52)
Data source: VoteView NOMINATE scores (UCLA/UC San Diego)
Policy Positions
533
total votes analyzed
Overview
David Valadao is a Republican U.S. Representative from California whose voting record marks him as one of the more moderate members of his party. Across 533 recorded votes, he shows strong support for legislation related to criminal justice, technology, banking and finance, and environmental and energy policy, while taking a more selective approach on healthcare, defense, and foreign policy matters. On economic issues, Valadao has generally supported budget and taxation measures brought by his party, voting in favor of the fiscal year 2027 budget resolution and continuing appropriations. His agriculture votes reflect a mixed pattern, which is notable given that he represents a major farming region in California's Central Valley. He has supported infrastructure and housing legislation at relatively high rates. Valadao's record on social issues is limited in the available data, with only single recorded votes on reproductive rights and civil rights. On immigration, he has voted in favor of related legislation about 63% of the time, a pattern that may reflect the demographics and priorities of his district. His foreign policy votes trend toward opposition, with a 36% support rate, including votes against War Powers Resolution measures regarding U.S. military involvement in Lebanon.
Key Positions
By Policy Area
Analysis updated: September 18, 2026
Campaign Finance
Includes all authorized campaign committees (principal committee, joint fundraising, and other authorized committees). Outside spending by Super PACs and independent groups is shown separately below.
Verify on FEC.gov →Career: $27.7M
Fundraising Over Time
Contribution Sources
43%
57%
0%
Individual Breakdown
Itemized (>$200)
$1.3M
Small Dollar (<$200)
$97K
Donation Sizes
Share of individual contribution dollars by donation size, current election cycle.
Where the Money Comes From
Itemized individual contributions only (donations over $200 report the donor's state). Small-dollar donations are not included because the FEC does not itemize them.
Top Contributors
Top Contributing Industries
Top Donor Employers
Employer as self-reported by itemized donors. “Not Employed” and “Self-Employed” typically rank highest for small-dollar campaigns and include retirees.
Where the Money Goes
Spending by Purpose
Purpose categories are self-reported on FEC filings; large “Other” totals are common.
Top Payees
ROSE STRATEGIES
CHASE - VISA
VALLEY VISION TREASURY
NO ON PROP 50 - STOP SACRAMENTO'S POWER GRAB
THE VOYAGEUR COMPANY LLC
KRAMER & ASSOCIATES
CAPITOL HILL CLUB
ARENA ONLINE
Detailed Breakdown
Expenditures
Operating Costs
$1.5M
Net Operating
$1.5M
Refunds
Individual Refunds
$44K
Committee Refunds
$3K
Outside Spending (Super PACs)
Supporting
$8.7M
Opposing
$34.3M
Total Outside Spending
$43.1M
Top Outside Spenders
HOUSE MAJORITY PAC
DCCC
NATIONAL ASSOCIATION OF REALTORS CONGRESSIONAL FUND
FAIRSHAKE
DEFENDING MAIN STREET SUPERPAC INC.
US CHAMBER OF COMMERCE
314 ACTION FUND
AMERICAN HOSPITAL ASSOCIATION PAC
Independent expenditures are made without coordination with the candidate. Source: FEC Schedule E filings.
Voting Record
533 votes across 19 categories